Features in Action
See how Modbus Connect makes industrial automation monitoring simple and powerful
Intuitive Dashboard
Everything you need in one place. Manage devices, monitor sessions, and view real-time data with a clean, modern interface.
- Sidebar with device list and drag-and-drop reordering
- Active monitoring sessions with status indicators
- Responsive design works on desktop and tablets
- Quick access to scanner and workspace management

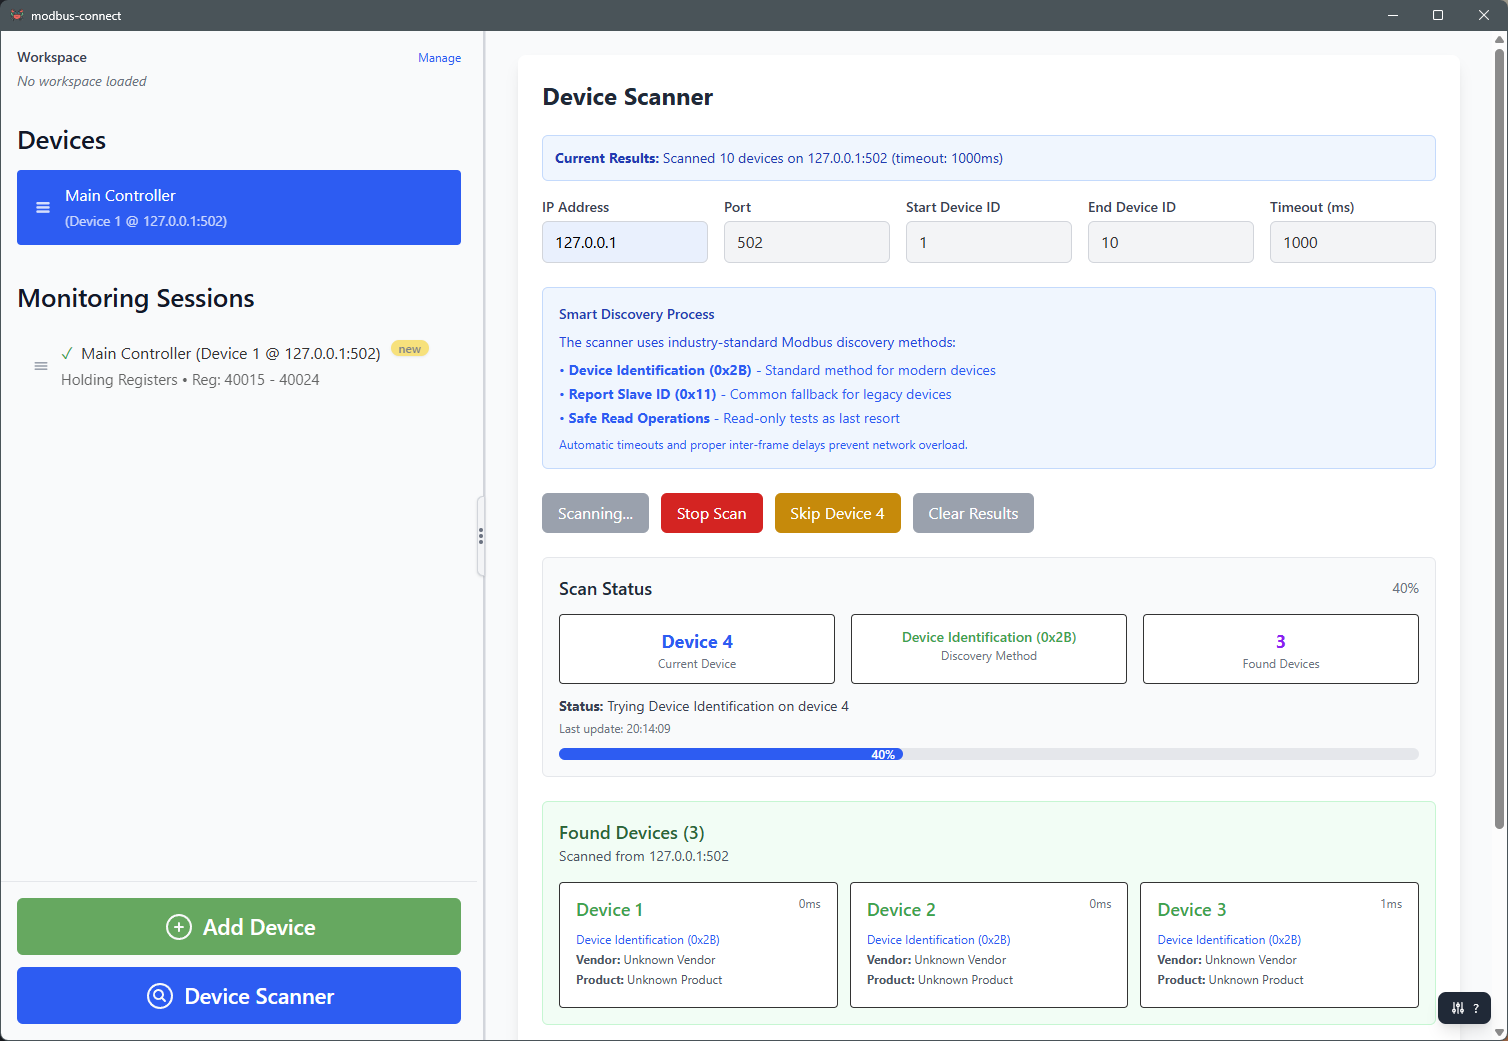
Smart Device Discovery
Automatically find all Modbus devices on your network with intelligent scanning. Scan single IPs or entire subnets with quiet and fast scan modes.
- IP range scanning with CIDR notation support (e.g. 192.168.1.0/24)
- Quiet mode for production networks and fast mode with concurrent scanning
- Scan device IDs 1-247 with configurable timeouts and duration estimation
- Extract device information (vendor, product code, model)
- Bulk add found devices with per-device IP display
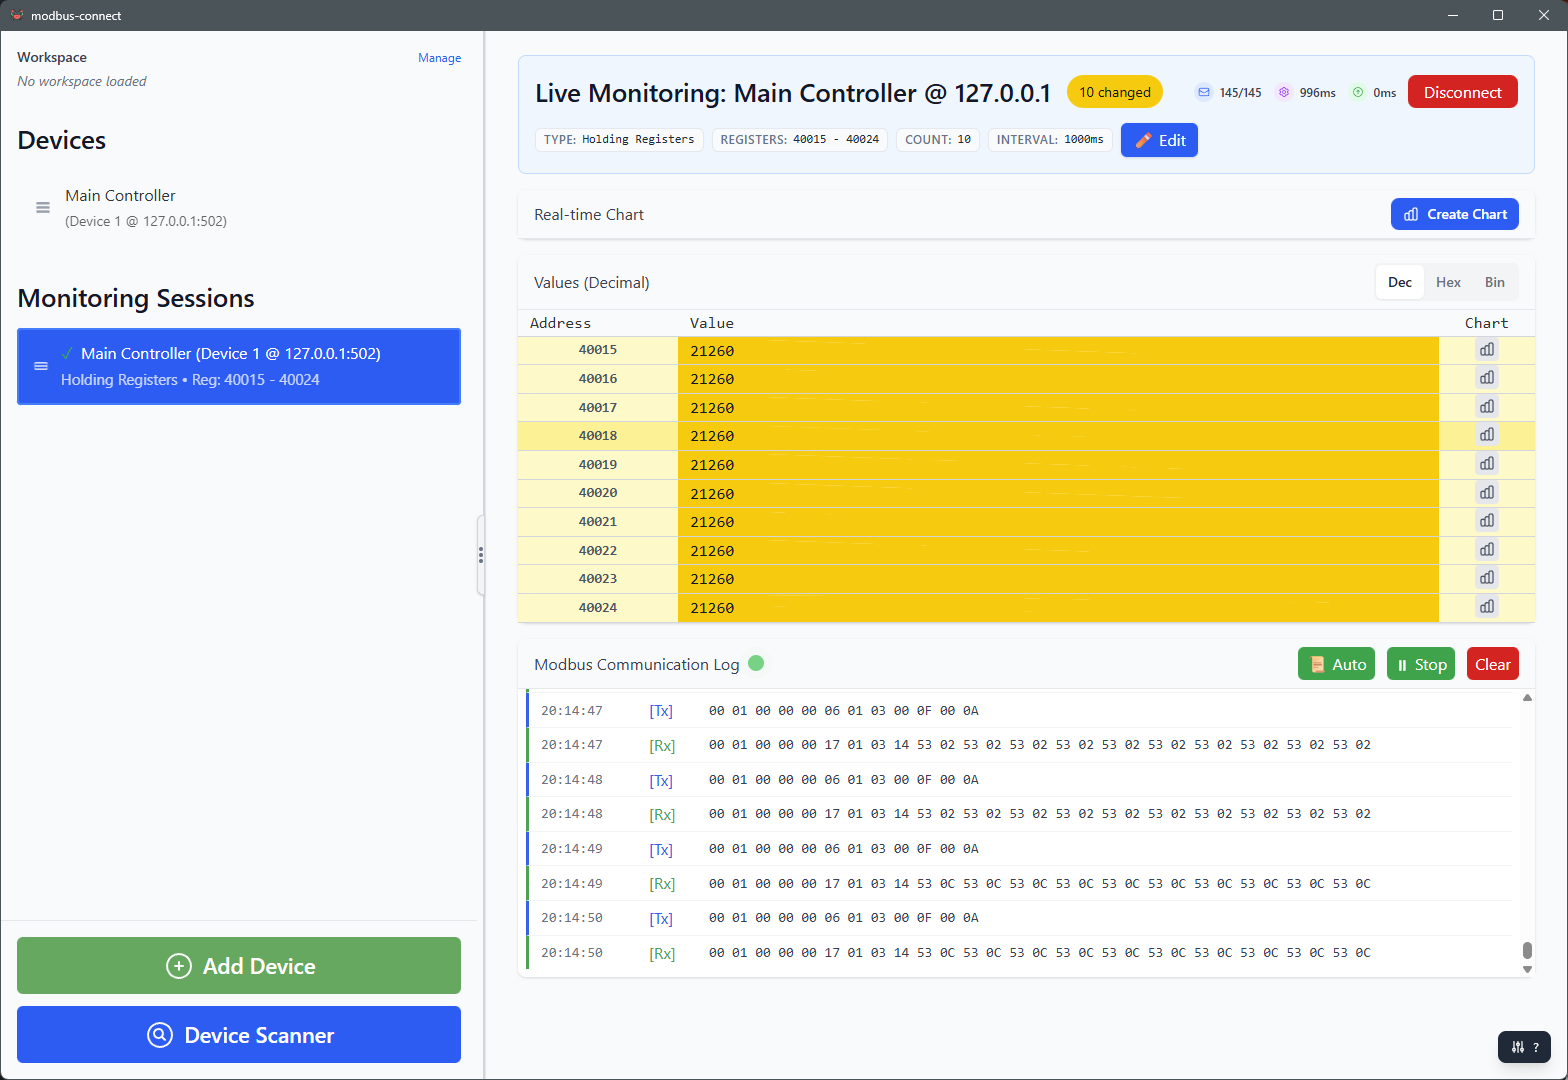
Real-Time Monitoring
Monitor register values in real-time with change detection, custom labels, and multiple display formats.
- Visual change highlighting (yellow background)
- Custom address labels for better organization
- Decimal, hexadecimal, and binary display formats
- Pause/resume sessions without losing data
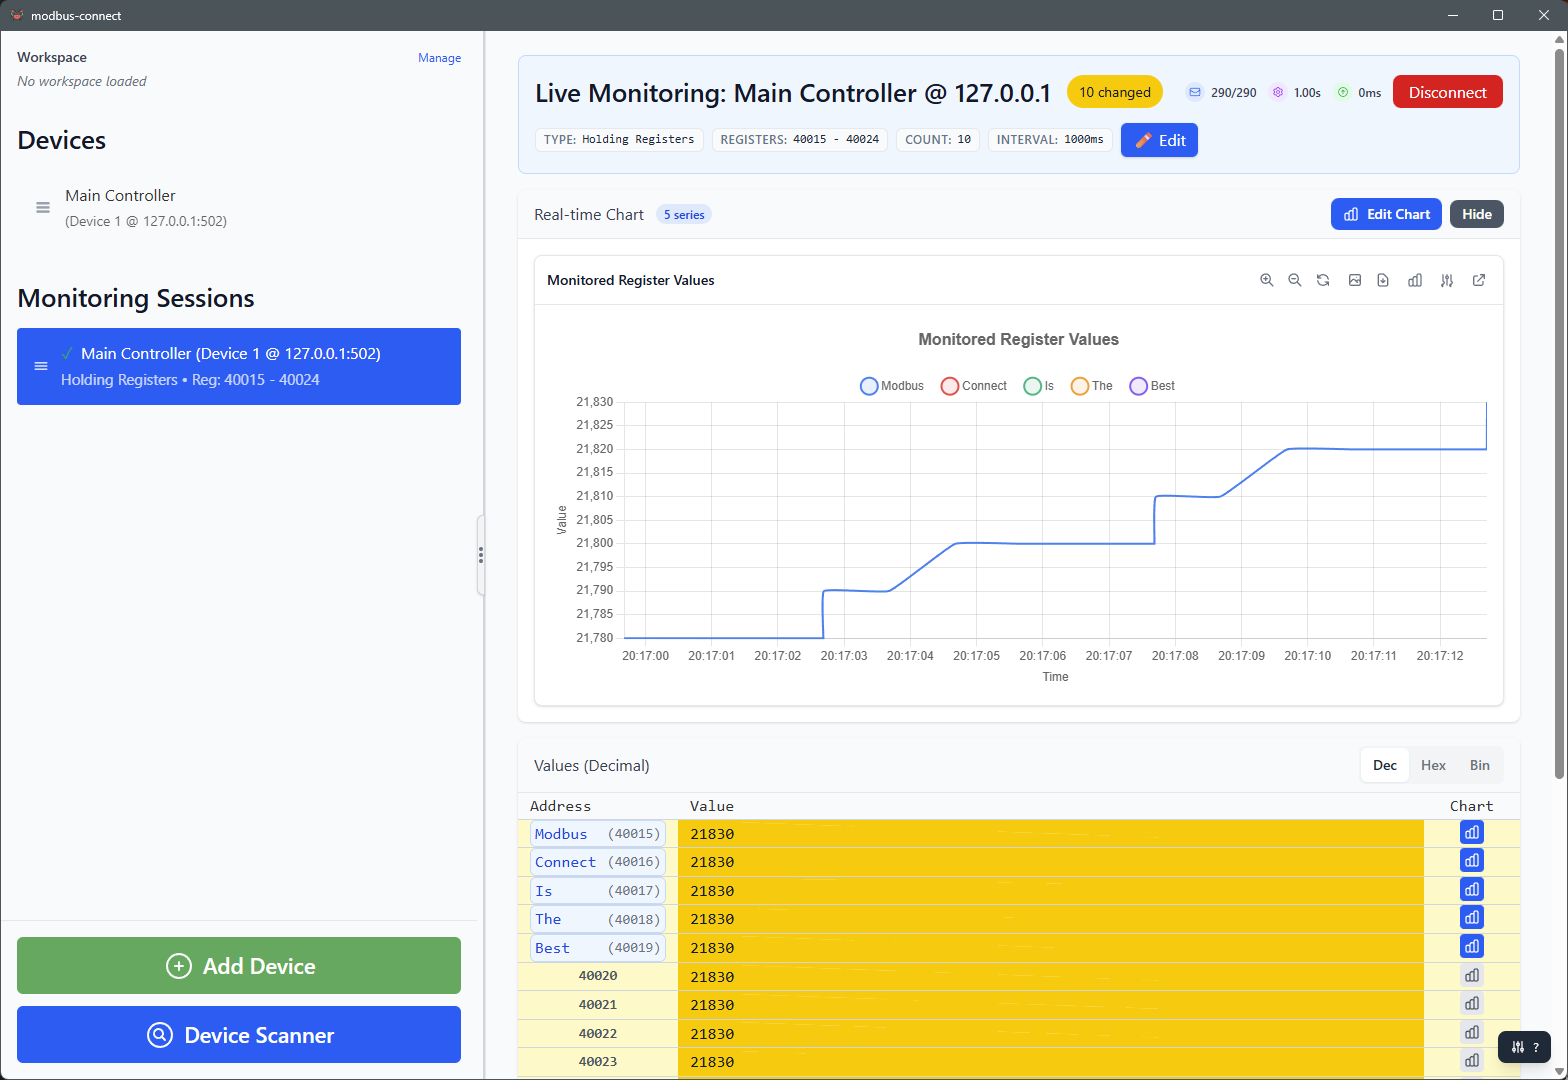
Professional Data Visualization
Create beautiful real-time charts with up to 12 data series. Perfect for trend analysis and documentation.
- Up to 12 data series per chart with custom colors
- Zoom and pan controls for detailed analysis
- Pop-out windows for multi-monitor setups
- Export chart data to CSV for further analysis
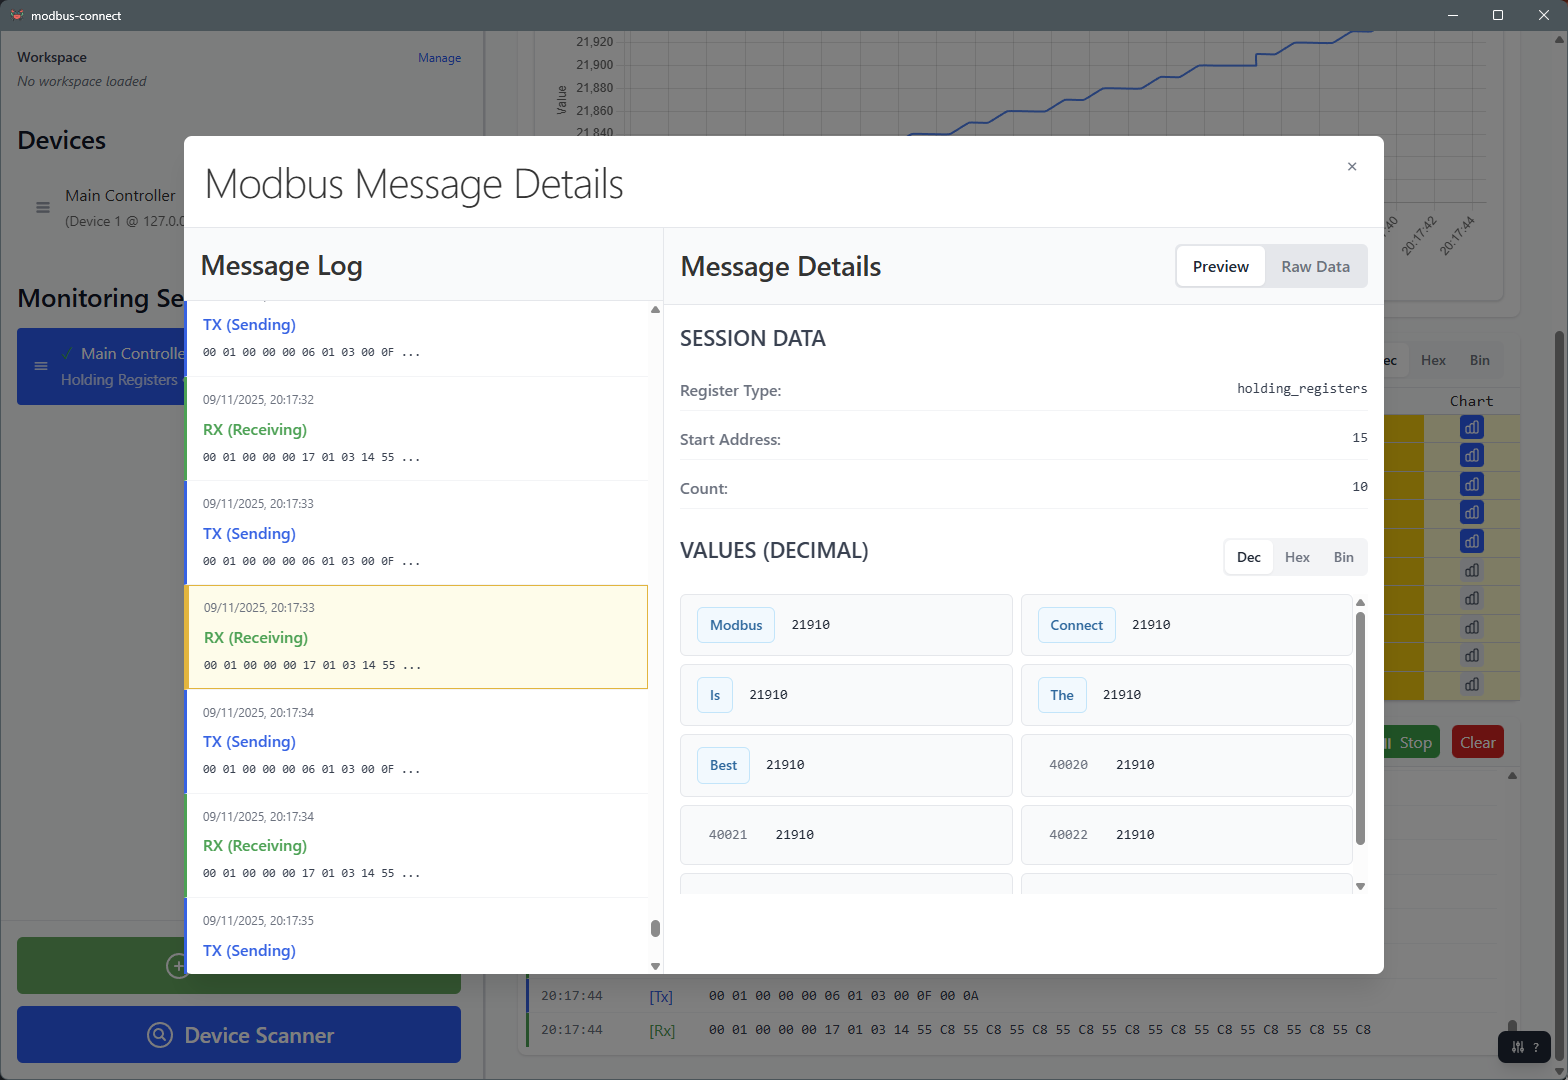
Protocol-Level Debugging
Inspect raw Modbus traffic with detailed TX/RX logging. Essential for troubleshooting and protocol analysis.
- Raw byte inspection with hex display
- Timestamps for every transaction
- Function code identification and error tracking
- Auto-scroll and manual navigation controls
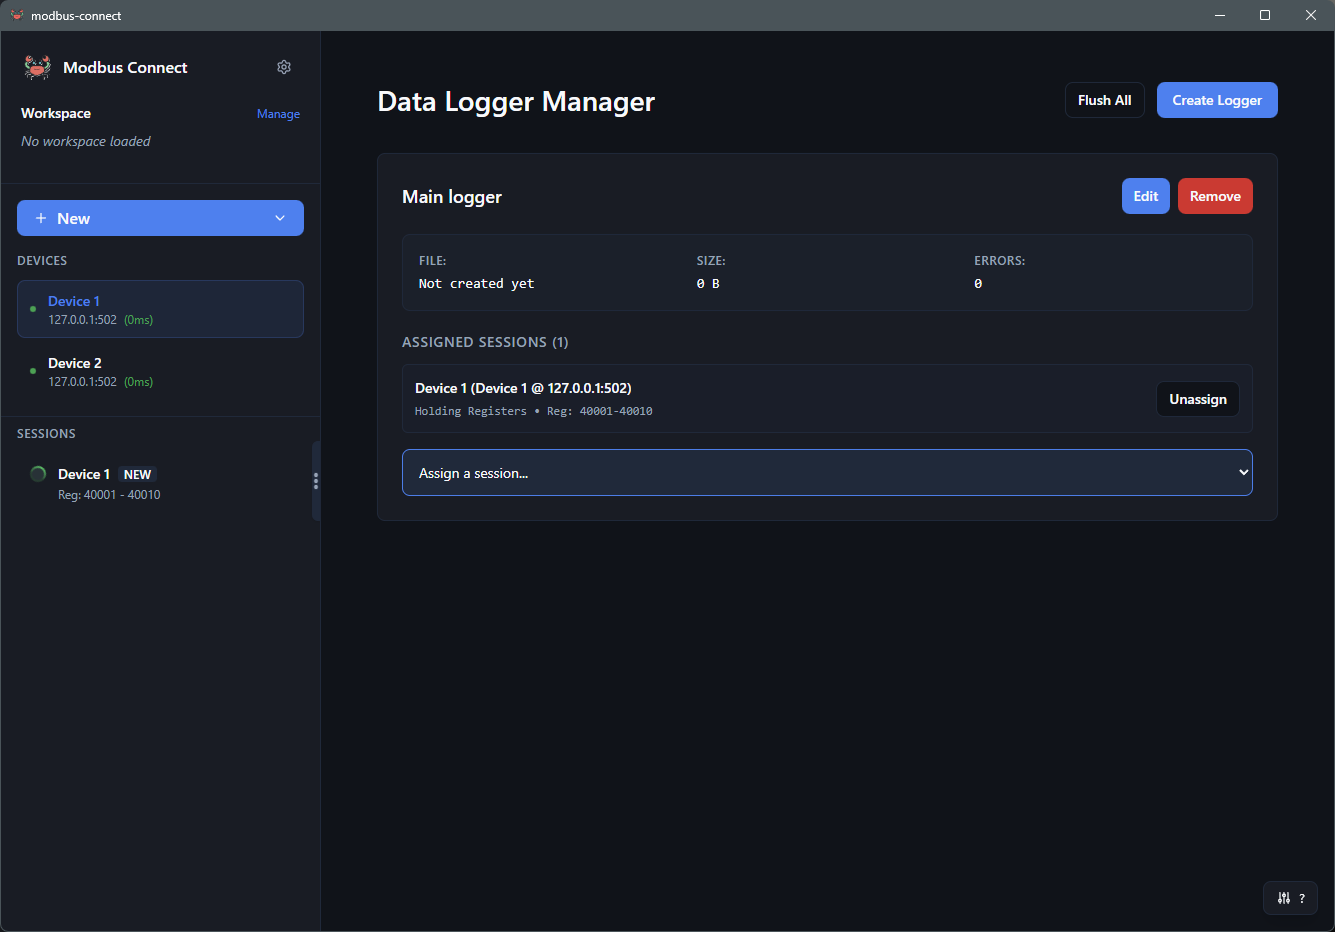
File Logging Service
Automatically log register data to files with multiple formats. Perfect for long-term data collection and compliance.
- CSV, JSON, and Tab-Delimited format support
- Configurable log rotation (Daily, Session, Size-based)
- Multiple concurrent loggers with different configs
- Real-time statistics and maintenance tools
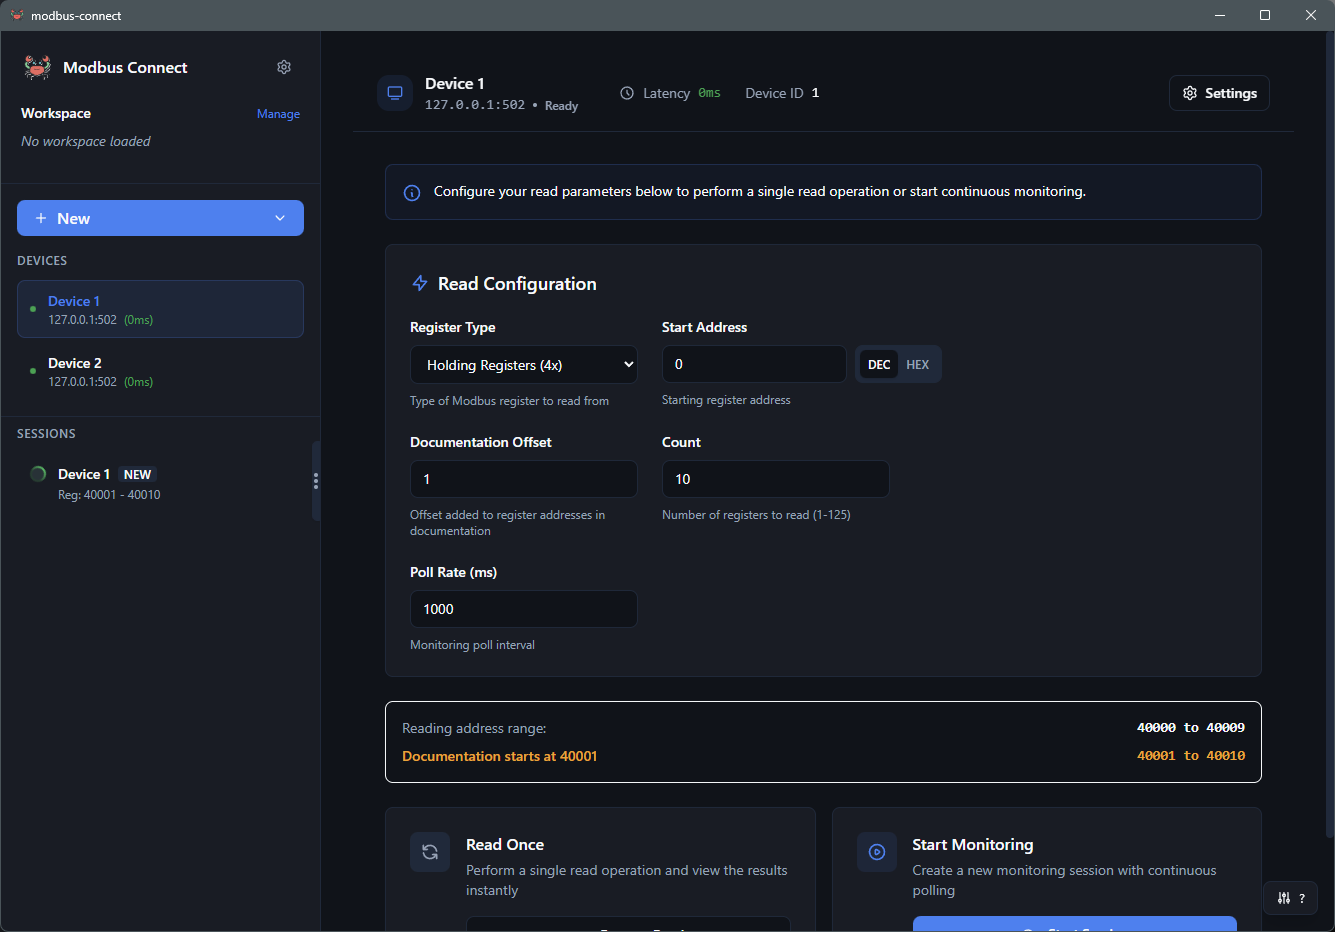
Device Configuration
Configure device settings and start monitoring sessions with an intuitive interface. Real-time latency display keeps you informed.
- Configure IP, port, device ID, and custom names
- Real-time network latency display
- Quick-start monitoring with register type selection
- Documentation offset support for 1-based addressing
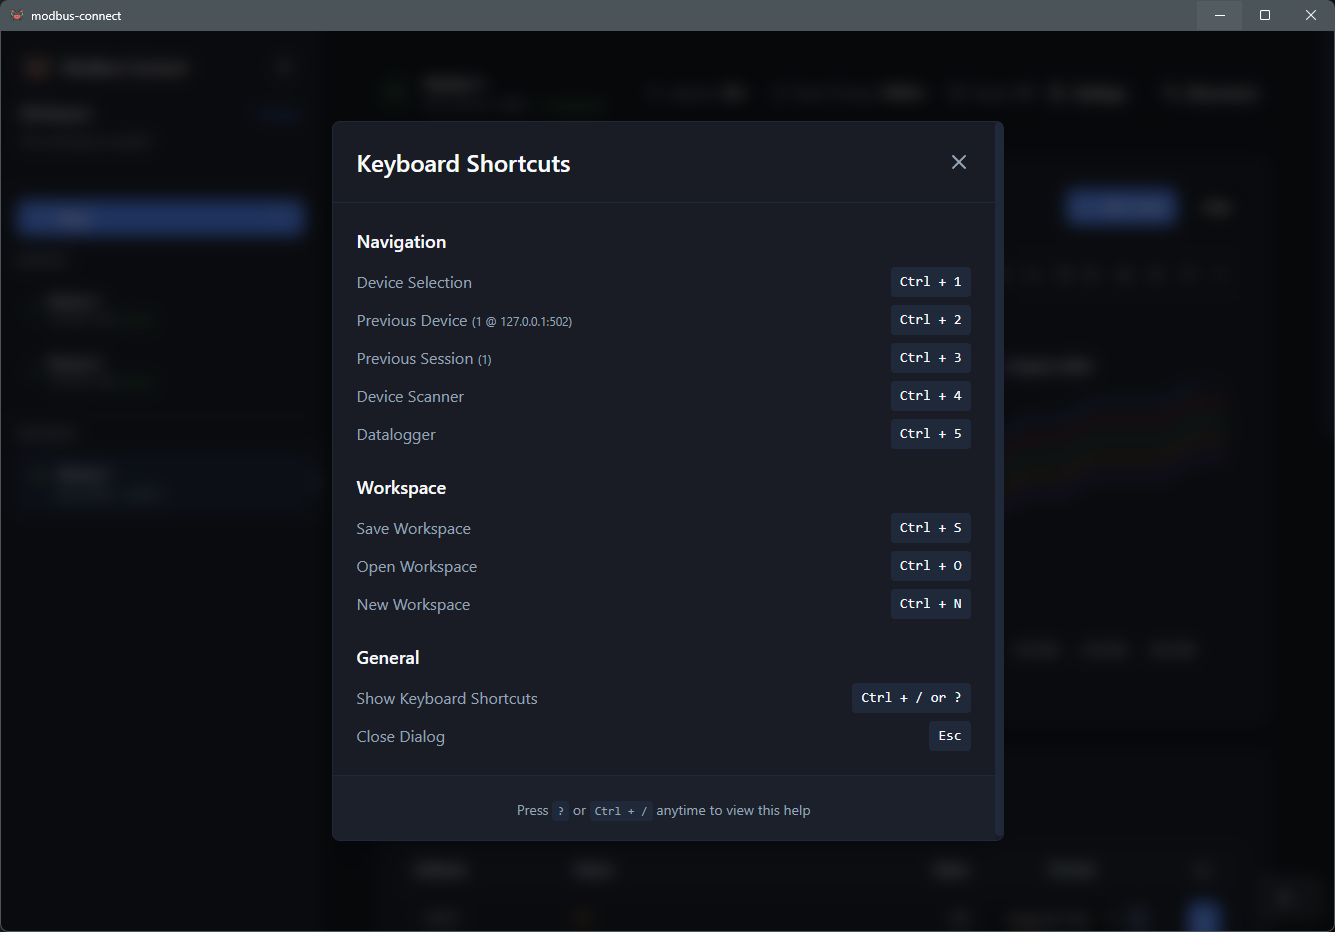
Power User Keyboard Shortcuts
Work faster with comprehensive keyboard shortcuts. Navigate between devices and sessions without reaching for the mouse.
- Quick navigation between views (Ctrl+1-5)
- Navigation history tracking for devices and sessions
- Smart shortcuts modal shows current selections
- Escape key closes all modals consistently
Ready to Get Started?
Download Modbus Connect today and experience modern Modbus monitoring
Download Free Beta